My other posts
Simplifying observability in .NET distributed systems
Table of contents
- Introduction
- Sample scenario
- Common ways to solve these issues
- A different, readable approach
- Giving more context to our scenario
- A common problem
- Using custom headers to identify operations
- Implementing the solution
- Setting the necessary headers for HttpClient calls
- Reading the request headers
- Logging the new data
- Implementation finished
- Extending the solution
Introduction
If you have ever worked on a team that built distributed systems, you have probably faced a situation where customers were complaining about errors in the system and you had to spend hours just to find out where the error was coming from.
Sample scenario
Let's take a look at a sample architecture using diagrams.net:
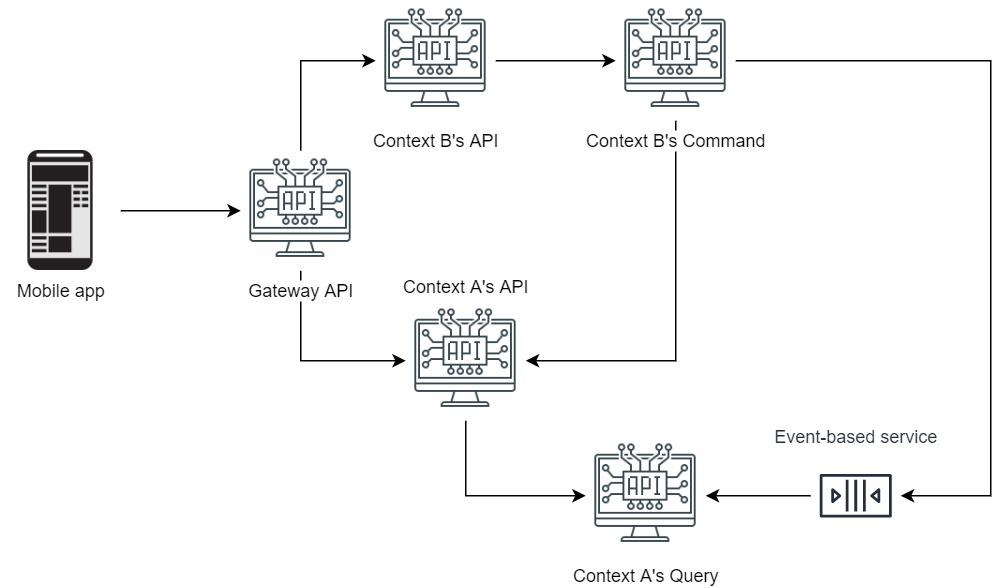
So, let's say we have a problem in Context A's query:
- Did it start from a query from the mobile app?
- Did it start from a query needed by Context B's command?
- Or did it start from a service triggered by an event which needs to query something?
Well, unless you have separate endpoints for each service, and are potentially duplicating code just for this purpose, you most likely don't have a simple way of determining where the request originated from.
Common ways to solve these issues
Using Correlation IDs
You could, for example, be using something like a Correlation ID to keep track of the request since it started through all the services. But, if that's the case and you have ensured that the same id is passed always, do you have a service such as ElasticSearch with Kibana to easily search for that Correlation ID without wasting several minutes switching between applications and search queries?
In my experience, either:
- There's a lack of proper infrastructure to support these searching needs, and/or
- CorrelationIds get lost somewhere when some team forgets to include it when calling a dependency, which sometimes gets even worse when these dependencies go on to generate their own CorrelationId when they didn't receive one.
Using OpenTelemetry
A new standard for taking care of situations like this, is OpenTelemetry, which has an official .NET library. The main idea is not entirely different to having a Correlation ID, but instead having a TraceId and a SpanId, where the TraceId represents the ID of the request and SpanId represents the ID of a specific unit of work in the system.
While the above sounds really nice, it's pretty much useless unless you have the proper infrastructure to produce and consume the logs, as well as the necessary system that analyses the traces and spans to build the request tree, such as through flame graphs.
In my experience:
- It's much more complex to properly understand OpenTelemetry and use it correctly and efficiently in applications.
- The infrastructure support is still not the best, given that the standard is quite new.
- To make matters worse, there's software such as DataDog that uses the same terminology for different concepts and even formats!
A different, readable approach
While working at a previous company, I realized that the above approaches share common problems:
- They're only useful once you have an ID - what do you do if users report a problem but there is no exception logged? It's likely that something didn't execute, but was that because of a bug or working as expected?
- Unless you have some good software with an easy-to-use UI, it's quite hard to explain either approach to non-programmers, like application support personnel.
Notice: the solution implemented throughout the rest of this post is supposed to extend any solution you might already have (like the ones above), rather than replace them.
Giving more context to our scenario
In order for this to make sense, we need to come up with an actual scenario. For this example, I'll be using an industry-agnostic order system based on a simple CQRS implementation:
Note: the above architecture might not be correct for some people, the idea is, however, not to design a perfect architecture but to have a context for our scenario.
So, what we have is:
- A mobile app.
- A Gateway API, the entry point to the system for the mobile app.
- An Order domain (with an API, Command, Query and Processor).
- A Customer domain (with an API, Command and Query)
For this simple scenario, imagine that all communication is done through HTTP except for the Order Processor, which is a Lambda (AWS)/Function (Azure) triggered by an event sent by Order Command.
In order to keep this short, let's think we have only the following operations:
Get Customer(Gateway API, Customer API, Customer Query),Create Order(Gateway API, Order API, Order Command),CreateOrderCommand(Order Processor)
Let's assume that Customer Query's Get Costumer endpoint is accessed in all three operations (to retrieve a customer, to validate a customer when creating an order, and to get the customer's address, respectively).
A common problem
Now that we have our context and operations, we can see that Customer Query's GetCostumer endpoint can be problematic. Imagine that we have this log:
Customer.Query.GetCostumer : Customer not found, returning 404.
Ok, someone submitted an invalid customer name. But which application, and why? In other words, at which point of which operation did we get an invalid costumer name? Were we supposed to receive that call or was it due to a bug?
Using custom headers to identify operations
The solution I found, together with a very good friend and member of my team, was to use 2 new headers in all calls throughout our system, independent of the method of communication:
x-client-name: Defines the name of the client/caller. It can be seen as a custom header with a purpose similar to the User-Agent header.x-operation-id: Defines the operation that provoked the call to the service.
Let's see an example using the Create Order operation:
1. Mobile app -> Gateway API
    Headers:
2. Gateway API -> Order API
    Headers:
        x-client-name: GatewayApi
        x-operation-id: GatewayApi.CreateOrder
3. Order API -> Order Command
    Headers:
        x-client-name: OrderApi
        x-operation-id: GatewayApi.CreateOrder
4. Order Command -> Customer Query
    Headers:
        x-client-name: OrderCommand
        x-operation-id: GatewayApi.CreateOrder
What if another domain needed to consume, for example, the operation for creating an order? That could look like this:
1. Another domain's service -> Order API
    Headers:
        x-client-name: ServiceName
        x-operation-id: ServiceName.CreateOrder
2. Order API -> Order Command
    Headers:
        x-client-name: OrderApi
        x-operation-id: ServiceName.CreateOrder
3. Order Command -> Customer Query
    Headers:
        x-client-name: OrderCommand
        x-operation-id: ServiceName.CreateOrder
With the above examples, I hope it's clear that:
- The
x-client-nameheader defines the caller, and changes on each segment of the operation, and - The
x-operation-idheader is defined by the entry point for the operation and remains static.
So, here's what we achieve with the above solution:
- We know which service is calling any particular endpoint.
- We can differentiate logs by filtering by the client name that we expect.
- If we have something like a Correlation ID, we can easily see where the flow stopped (if sooner than expected) or which calls did that shouldn't have happened.
Implementing the solution
Now that we have an idea of what we want to do, we need to implement it in such a way that it's easy to determine if a given service is correctly following the solution or not. For this reason, I recommend to abstract away all the logic in a separate, reusable library.
Note: the final solution implemented here can be found in my GitHub Blog repository.
There are 3 main points that we need to take care of for this solution:
- Setting the headers when calling a microservice
- Reading the headers on each microservice
- Add the headers to log scopes, so they are present for all logs in the request
Let's first define our constants:
public static class Constants
{
   public const string ClientNameHeader = "x-client-name";
   public const string OperationIdHeader = "x-operation-id";
}
Setting the necessary headers for HttpClient calls
The easiest way to do this is to create an extension method that adds the headers to the HTTP calls for a given microservice.
public static class HttpClientBuilderExtensions
{
    public static IServiceCollection AddMicroserviceClient<TInterface, TClient>(this IServiceCollection services, Action<HttpClient> clientConfiguration, string serviceName)
        where TInterface : class
        where TClient : class, TInterface
    {
        services
            .TryAddSingleton<OperationIdDelegatingHandler>();

        services
            .AddHttpClient<TInterface, TClient>(client =>
            {
                clientConfiguration(client);

                client.DefaultRequestHeaders.Add(Constants.ClientNameHeader, serviceName);
            })
            .AddHttpMessageHandler<OperationIdDelegatingHandler>();

        return services;
    }

    private class OperationIdDelegatingHandler: DelegatingHandler
    {
        protected override Task<HttpResponseMessage> SendAsync(HttpRequestMessage request, CancellationToken cancellationToken)
        {
            var activity = Activity.Current;

            if (activity != null)
            {
                var operationId = activity.GetBaggageItem(Constants.OperationIdHeader);

                if (!string.IsNullOrEmpty(operationId))
                {
                    request.Headers.Add(Constants.OperationIdHeader, operationId);
                }
            }

            return base.SendAsync(request, cancellationToken);
        }
    }
}
You could then use the extension method above instead of calling the usual AddHttpClient method. Notice that I used one overload which provides some flexibility with the clientConfiguration parameter, but it should be quite straightforward to extend the solution above to support other AddHttpClient overloads.
The Activity class used above comes from the System.Diagnostics namespace. The documentation is a great starting point for learning about it, but basically what we're doing is to get an item from the current Activity, which is started by ASP.NET Core automatically. We'll be adding that item to the Activity next.
Reading the request headers
Now that we can send the headers, we need to read them as well. The easiest way to have this for all endpoints is by using a middleware, which, if placed accordingly in the pipeline, will not be run for static files, among others.
There's one tricky bit, however. We need to not only read request headers for requests that have them (for example, in Order Command), but we also need a way to have the data available when we don't have the headers (in our entry points, like the Gateway API).
For this example, I decided to use a single class to handle both scenarios. For production scenarios, it might make more sense to split them out into 2 classes.
public class CustomHeadersLoggerMiddleware : IMiddleware
{
    private readonly CustomHeadersLoggerOptions _options;
    private readonly ILogger<CustomHeadersLoggerMiddleware> _logger;

    public CustomHeadersLoggerMiddleware(CustomHeadersLoggerOptions options, ILogger<CustomHeadersLoggerMiddleware> logger)
    {
        _options = options;
        _logger = logger;
    }

    public async Task InvokeAsync(HttpContext context, RequestDelegate next)
    {
        if (!string.IsNullOrEmpty(_options.DefaultServiceName))
        {
            await HandleServiceAsEntryPoint(context, next);
        }
        else
        {
            await HandleServiceAsDependency(context, next);
        }
    }

    private async Task HandleServiceAsEntryPoint(HttpContext context, RequestDelegate next)
    {
        var operation = context.Request.Path.Value.Split('/', StringSplitOptions.RemoveEmptyEntries).Last();
        var operationId = _options.DefaultServiceName + "."
            + context.Request.Method + ":"
            + operation;

        Activity.Current.AddBaggage(Constants.OperationIdHeader, operationId);

        await next(context);
    }

    private async Task HandleServiceAsDependency(HttpContext context, RequestDelegate next)
    {
        context.Request.Headers.TryGetValue(Constants.ClientNameHeader, out var clientName);

        if (clientName.Count != 1)
        {
            context.Response.StatusCode = StatusCodes.Status400BadRequest;
            var details = new { Error = "A x-client-name header is required for this API" };
            await context.Response.WriteAsync(JsonSerializer.Serialize(details));
            return;
        }

        context.Request.Headers.TryGetValue(Constants.OperationIdHeader, out var operationId);

        if (operationId.Count != 1)
        {
            context.Response.StatusCode = StatusCodes.Status400BadRequest;
            var details = new { Error = "A x-operation-id header is required for this API" };
            await context.Response.WriteAsync(JsonSerializer.Serialize(details));
            return;
        }

        Activity.Current.AddBaggage(Constants.OperationIdHeader, operationId[0]);

        await next(context);
    }
}
There are 2 main methods for the middleware above, let's review them:
HandleServiceAsEntryPoint:
This method contains the necessary logic for the application acting as an entry point, like the Gateway API. The most important part in this method is obtaining the correct Operation ID, which can be tricky.
A nice way to achieve this is to use Attributes on Controller actions and then building a list of these at application start up to then be able to reference fast.
HandleServiceAsDependency:
This is the opposite case, where we know that the caller should have sent the headers containing the Operation ID and Client Name.
In the sample above, I decided to return Bad Request if the caller did not include the headers, which can be too strict depending on your requirements. If the logic for determining the entry point is correctly done, it might make more sense to fall back to the default Operation ID and/or Client Name, and perhaps log a warning indicating the bad usage.
Logging the new data
The way I prefer to do this is by adding the data as log scopes. If you use a good logger like Serilog, the way the scopes are logged make it very easy for tools like ElasticSearch to index, which can drastically help searching for this data when needed.
Fortunately, doing this is the easiest part of all, since we already have the data.
For example, we can do just:
using var clientNameLogScope = _logger.BeginScope("{ClientName}", clientName);
using var operationIdLogScope = _logger.BeginScope("{OperationId}", operationId);

_logger.LogInformation($"Starting operation {operationId}");

await next(context);
Since our middleware runs before the endpoint (Controller, for example), this ensures that the data is appended to all logs, and we don't have to worry about it being duplicated or missing.
Implementation finished
With the simple code above, we have a good part of our implementation done. There are some other pieces that are needed to make it nice and clean, but the most important parts are there to modify and extend as needed.
Here's a sample output of Customer Query after running the code above:
info: CT.Example.Customer.Query.Controllers.CustomersController[0]
      =>
      SpanId:dbad30b5f3a82a40,
      TraceId:80fa59f6c72c414aa0c713db14138bff,
      ParentId:8a4ce6a28321d54f
      =>
      RequestPath:/customers/a
      =>
      Example.Order.Command ---> x-client-name
      =>
      Gateway.POST:Orders -----> x-operation-id
      =>
      Getting customer by name: a
Remember that you can find the sample code ready to run on my GitHub repository.
Extending the solution
I focused on ASP.NET Core services in this post to keep it short and simple, as well as generic. However, keep in mind that:
- If you have a service such as an NServiceBus processor, you can pass the data as message headers, and then create a Behavior to read and log the data.
- For services such as AWS Lambdas backed by SQS or SNS, you can also pass the data as message headers, but there is no unobtrusive way to read and log the data.
- For other types of services, consider either passing the data as message headers (if available), or pass it as properties along with other correlation data.
I hope you have enjoyed this rather lengthy post, and I really hope you find it useful. As always, please feel free to reach out in comments.